Showing posts with label Performance Monitoring. Show all posts
Showing posts with label Performance Monitoring. Show all posts
Thursday, 18 May 2017
Friday, 4 September 2015
Performance Monitoring & Analysis on various tiers like Web, Application, Middle Layer and Database levels
Types of Logs which needs to be monitored at various tiers:
Web Server Layer:
Web Server Layer:
- SSO Logs for Authentication errors
- Plugin Logs for connectivity error between Web & Application component
- Access Logs for HTTP Error like HTTP404, HTTP500 etc.
Application Server Layer:
- sysout logs for exceptions & timeouts
- syserror logs for database exceptions & application errors
Tibco Layer(Middle Layer):
- EMS Queues for checking queue depth
- Mediation Services
- ESB Operations
Database Layer:
Analyzing Performance Test Results
Once Performance test is completed, the logs and results are collected from the controller machine.
The Performance report can be prepared with following:
LoadRunner Analysis Reports
The Performance report can be prepared with following:
LoadRunner Analysis Reports
- Transaction Response Times
- Transaction Pass/Failed
- Throughput (Kilobytes/sec)
- Errors Rate vs. Load on the system
- Degradation of response times with load on the system
- Logs
Performance Testing Types
Smoke or Sanity tests
After Test sets/Load profile created, a ‘Smoke or Sanity tests’ on the scripts will be executed to ensure if the scripts and the application configuration are done correctly. This is must for any kind of performance test. This will be planned for a week. Any defects identified in the dry-run will be fixed during this phase. Smoke test or sanity tests are run with 1 user for each script for the first time. If everything looks good, then actual workload is incorporated to see whether the application is stable under pre-defined load.
If everything goes fine, then actual load and other performance tests like Soak, Failover, Breakdown testing is performed.
Load Tests
The actual test execution happens at UAT Environment. The User load details have to be suggested by the clients or Performance team can decide depending of number of transactions to be achieved (For WEPO Application the normal load is 130 users).
While the test is running, monitors in different tiers (at tool level, application server level, database server level) are observed through Controller and these observations are noted for every test conducted.
Monitoring at application-server level and database-server level will be supported by Client, whenever necessary.
Stress Tests
Stress Testing is normally used to understand the upper limits of capacity within the system. This kind of test is done to determine the system's robustness in terms of extreme load and helps application administrators to determine if the system will perform sufficiently if the current load goes well above the expected maximum.
Soak Tests
Soak Testing, also known as endurance testing, is usually done to determine if the system can sustain the continuous expected load. During soak tests, memory utilization is monitored to detect potential leaks. Also important, but often overlooked is performance degradation, i.e. to ensure that the throughput and/or response times after some long period of sustained activity are as good as or better than at the beginning of the test. It essentially involves applying a significant load to a system for an extended, significant period of time. The goal is to discover how the system behaves under sustained use. It is run for 24 hours for both of the applications.
Failover Tests
After the relevant load, stress and soak tests are performed, failover tests are conducted which determines at what point the application crashed does and this happens in coordination with the production support teams
and database team, which works to first kill the DB node and stop the instance on that DB node for 10 minutes and then restarting the instances. In these 10 minutes time frame it is checked to see whether application crashes completely or it recovers back. If, it recovers it is analyzed how much time it takes for the application to recover back. Also, the number of failed transactions is checked during this time frame to check whether it
is crossing the predefined threshold or it crosses that bar. It was also tested and certified accordingly.
Scalability Tests
In Scalability testing, it is checked that if application is stable under the certified load, then users are subsequently increased and also DB connections was changed to 3500 from 2500 which supports more users load at one point of time and it is tested and certified accordingly. Also, the server’s configuration was increased on the performance testing environment and this was also tested to check that resources are scaled accordingly with good load tests.

Loadrunner Architecture
HP LoadRunner by default installs 3 icons on the Windows desktop:
- Vugen (Virtual User Generator) for generating and editing scripts.
- Controller for composing scenarios which specify which load generators are used for which
- Scripts and for how long, etc. During runs the Controller receives real-time monitoring data and displays status.
- Analysis which assembles logs from various load generators and formats reports for
- Visualization of run result data and monitoring data.
- Agent process that establishes connection between controller and load generator.
- Load generator generates the load against the application.
- LoadRunner supports various application protocols; Flex AMF, Citrix ICA, Remote Desktop Protocol (RDP), ERP/CRM (e.g. SAP, Oracle eBusiness, Siebel and PeopleSoft), Databases, Mail Clients, Web Services, and AJAX TruClient (with V.11.0).

Loadrunner & It's Benefits
HP LoadRunner is an automated performance and test automation product from Hewlett-Packard for examining system behavior and performance, while generating actual load. HP acquired LoadRunner as part of its acquisition of Mercury Interactive in November 2006. HP LoadRunner can simulate thousands of concurrent users to put the application through the rigors of real-life
User loads, while collecting information from key infrastructure components (Web servers, database servers etc.) The results can then be analyzed in detail, to explore the reasons for particular behavior.
Benefits
User loads, while collecting information from key infrastructure components (Web servers, database servers etc.) The results can then be analyzed in detail, to explore the reasons for particular behavior.
Benefits
- It is very easy to install and deploy. It need not be installed on the server under test.
- Also the modularity of the application gives the users the choice of installing only the required components, such as Vugen, LR Analysis, LR Agent and Controller
- Uses ANSI C as the default programming language and other languages like Java and VB
- Excellent monitoring and analysis interface where you can see reports in easy to understand color charts and graphics
- Supports a wide variety of protocols including Citrix, Sybase, Streaming protocols, tuxedo, CORBA and lots more
- Very intuitive and easy to use. Needs very little training to begin with.
- Makes correlation much easier
- Nice GUI generated script through a one click recording
- Excellent tutorials, exhaustive documentation and active tool support from HP
- Allows you to effectively control all VUsers from single point of control
Thursday, 20 August 2015
Reading AWR Reports (Basic Approach)
If you are new to the AWR reports, the first thing you should probably do is run the ADDM report for the specific time period. The ADDM report provides root cause analysis of the parts of the system consuming the most time. It is often quicker to start with the ADDM report to help narrow down your area of focus in the AWR report.
When looking at an AWR report, a good place to start is the "Top 5 Timed Foreground Events" section, near the top of the report. This gives you an indication of the bottlenecks in the system during this sample period.
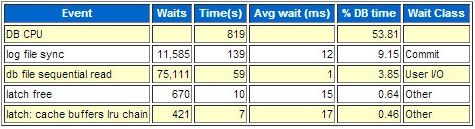
Once you've identified the top events, drill down to see what SQL and PL/SQL are consuming the majority of those resources. On the "Main Report" section, click the "SQL Statistics" link.

On the "SQL Statistics" section, click the "SQL ordered by ??" link that most closely relates to the wait event you identified in the "Top 5 Timed Foreground Events" section. In this case, the "DB CPU" was the top event, so it would seem sensible to try the "SQL ordered by CPU Time" link first.

You are then presented with the SQL and PL/SQL that are using most of the specified resource during the sample period. You can then attempt to tune these areas to reduce the impact.

Friday, 14 August 2015
Performance Monitoring
Application Performance Monitoring (APM) allows you to detect application performance issues – before your customer does. Application Performance Monitoring ensures Web application performance meets your customer's expectations and consistently delivers their business SLA.
Subscribe to:
Posts (Atom)